While implementing Semantic Segmentation using Adversarial Networks, I came across a normalization technique called Local Contrast Normalization. Before feeding the image into the segmentor network, the image undergoes this normalization. Then I came across other ways to normalize image data. Like Simplified Whitening, Local Response Normalization. Here is a great article on the same where I drew my inspiration from. But I wanted to see for myself, how the image turns out after being normalized. I was not able to find it online. So I decided to try these techniques on a few images myself. I have outlined the processes briefly. To follow a detailed explanation of these techniques, please go through the article I have linked above.
Simplified Whitening
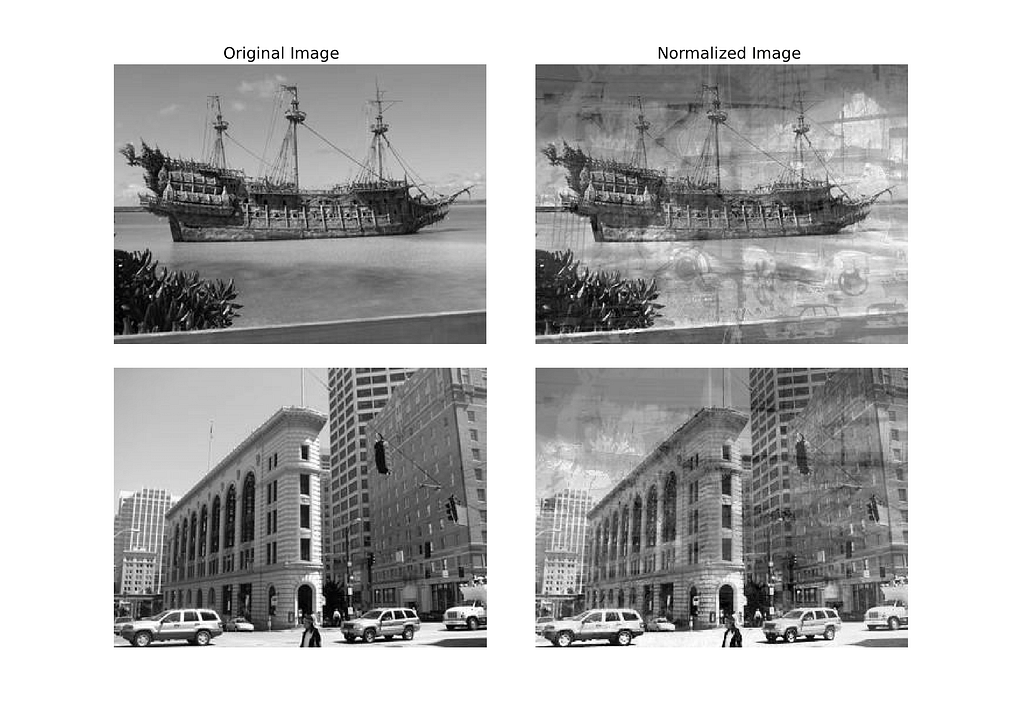
This normalization involves all the image in a dataset at once hence done before any training starts. The mean and variance of the pixels across the batch is calculated and then centered and scaled respectively. It’s said that it speeds up convergence.
Here are few examples :-
Local Contrast Normalization
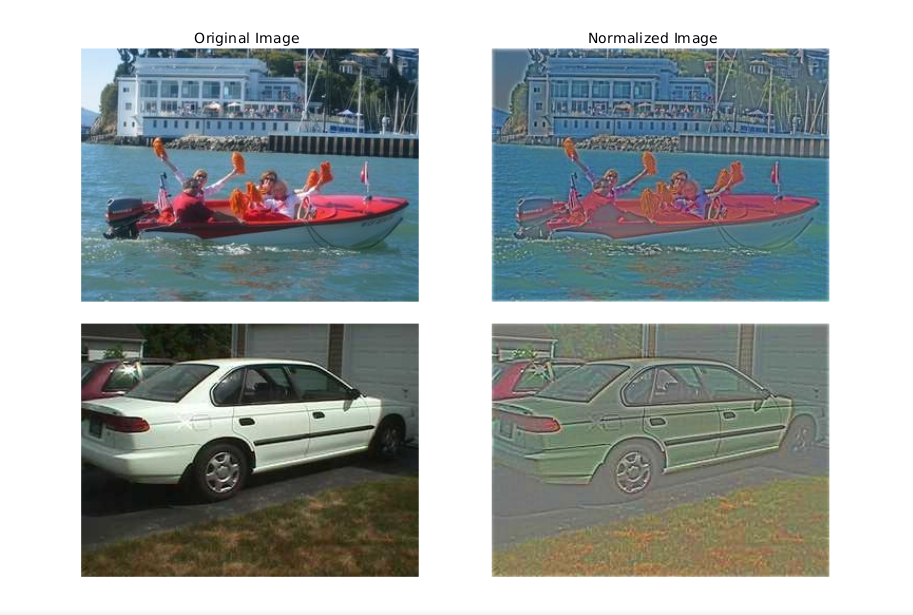
In this, there is a competition between a pixel and it’s locality of a given radius. It’s original paper used a radius of 9. A kernel of 9x9, whose weights are Gaussian of mean 0 and variance 1, is convolved on the image across the channels. After centering the image (by subtracting the above output from the image), it’s variance is determined. Then, the mean of standard deviations of all the pixels is found. After which, the centered image is divided by max(standard_deviation, mean_standard_deviation) to get the LCN_Image.
Here’s how it looks like :-
Local Response Normalization
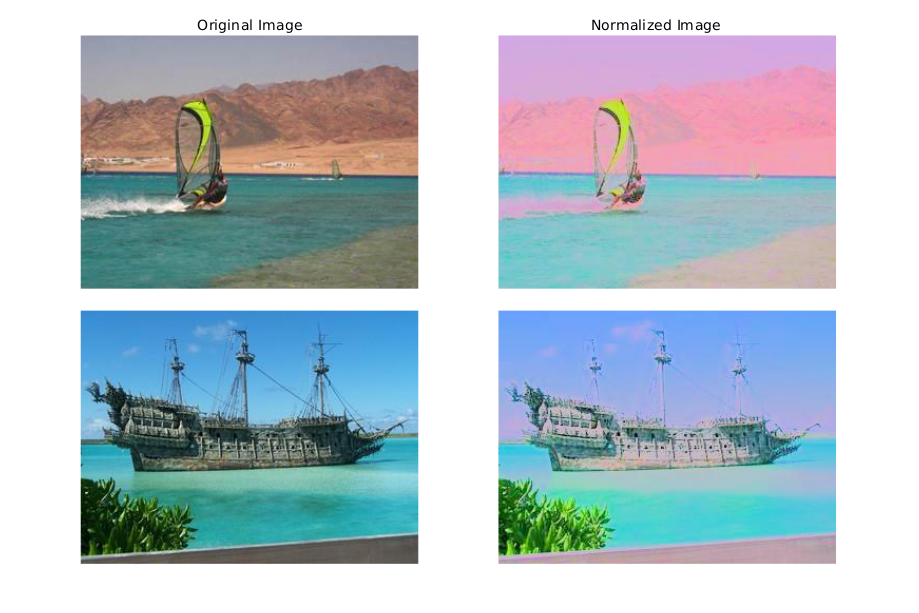
This is similar to LCN in the way that it tries to introduce competition between the pixels but differs in the way that the competition occurs between the adjacent convolution outputs. It’s explained very well in the article and I recommend you to go through it.
This is how it looks :-
This was a fun exercise to do and I learnt a lot in the process.
Pro Tip: Prefer using matplotlib.pyplot to view images over PIL.
Thanks to yeephycho, jostosh’s post on LCN and /r/MachineLearing for their help! :D
Code Repository :- https://github.com/dibyadas/Visualize-Normalizations
If you have suggestions and feedback, please feel free to reach out to me.
Visualizing Different Normalization Techniques was originally published in Towards Data Science on Medium, where people are continuing the conversation by highlighting and responding to this story.